
|
Knowledge Base Home | Submit a New ticket |
Dashboard Reports.
Article Id: #1 Viewed: 1262 times Last updated on: 17 Aug 2019 Article Category: CBPSoft DashboardUnderstanding how Reports work.
Due to the nature of the Web and Browser technology the Reports work differently on the web than they do on FasTrax. Since some reports could take a long time to run and could cause the browser to time out, It was decided that it would be best for the system to submit the job to the server and then let the report run as a background process, that frees you up to continue doing other things on the Dashboard while the report is running.
So when you run a report you must first enter the parameters that you want for the report and then select which device you wish to send the report too.
As you will notice just about every report contains the following options in the Toolbar menu.
.png)
Clear: This clears any parameters you've entered and allows you to start all over.
Save: This allows you to save the report parameters to set the report to be run at a specific time or to be scheduled to run on a repeatable basis. (See below for more information on this option).
Grid: This allows you to send the report to a grid. (More on this below).
Excel: This allows to you send the report to Excel.
Printers: This allows you to get a Text File of the report suitable for sending to the printer.
Exit: Exit's the screen without running the report.
Help: View this help screen.
About: View About information on this report, Usable information to send to ATS when reporting a problem.
HelpDesk: This button allows you to create a help ticket or view a list of open or closed tickets you've created.
Once you've entered your desired parameters press either the Grid, Excel or Printers button to request the report. Once you do that you should see the following message.
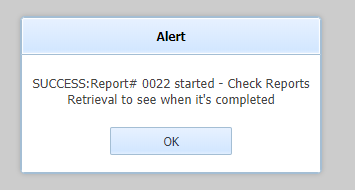
So in order to view/download, your completed report you will need to click on the Report Retrieval Accordion under the Message Center, which is at the bottom left-hand side of your screen.
.png)
When you click on the Reports Retrieval bar the section will expand and display the reports you've requested. You can click on the Refresh-button to refresh the list.
.png)
The color of the row will change based on the following:
- Blue means the report has started to run but not finished.
- Green means report has finished and is ready for retrieval.
- Red means report finished but an error has occurred.
- Yellow means the report has already been retrieved.
Once the report is finished you can double click on any the lines and you will see the following window:
.png)
This window shows you the Report you requested and the Parameters you selected for the report.
If the report has completed you and the report has generated data you can click on the Download Button (see toolbar) to download the report to whichever Device you had selected.
Delete allows you to delete the report from the list once you've downloaded of if the report did not generate any data.
Understanding the Grid Option
If you sent the report to the Grid when clicking the download button the system will open a window showing you a grid of the data generated by the report. The advantage to this is that you can use several Filtering methods to view the data, sort it, hide/show columns prior to sending it to Excel or the printer.
.png)
The input fields above each column header will allow you to enter some information and thereby filter data from that column.
The toolbar at the bottom of the grid will allow you to send the filtered report to excel or to your printer as well as Hide-show columns you may not want on the report.
.png)
Simply click on the Hide-Show down arrow and select the column you want to hide/show. (This is an On-Off scenario).
Understanding the Save Report Option
Notice that in any report which is based on a starting and ending date range we have added a 'Select Date Range:' option.
This field contains the following options:
.png)
By adding this options it will allow the report processor to insert the appropriate dates to the report if the report is being set to run on a repeatable basis.
So to make this work, you would define all the parameters you want including the date range and then click on the Save button.
The save button gives you two options:
.png)
The first option is to create a new scheduled report and second option to view a list of previously saved reports.
The save Report Parameters options displays the following window:
.png)
Here you will be able to set up when to run, how long, to whom you want to send it and how often you want the report to run.
These are your options:
Run Report at?: 3 options are available. 1) Night Time - Report will be scheduled to run right after 12AM. 2) Early morning, Report will be scheduled to run at 5am, 3) After 5pm, Report will be scheduled to run after 5pm.
Deliver me a Copy Via: You have 3 options here. 1) Report Dashboard, 2) Email, 3) Don't want a copy. (Default is Don't want a copy) Option one means the report will be delivered to your Reports Retrieval Dash-let. 2) Means a copy of the report will be delivered to your email. (NOTE: Grid option does not work with email) and 3 means you don't want a copy of the report.
Start Running On: Date you would like the report to start running.
Stop Running On: Date you would like the report to stop running. (Blank means it will go on forever).
Report Device: Options are (Grid, Excel, Flat File) - Grid option does not work for Emailing.
Send Report to all Users of Department: This allows you to send a copy of the report to all users assigned to a specific department.
Repeat Event: Click on the check mark to make this a repeatable event, which will active the "Frequency and Select Days" fields.
Frequency?: This select box has the following options. 1) Daily, 2) First Day of the Month, 3) Last Day of the Month, 4) 1st and 15 of the Month, 5) Specific Days of the Week. Selecting "Specific Days of the week" will require you to select which days.
Select Days: If you selected "Specific Days of the week" then you use this field to select which days.
.png)
This grid section will allow you to define multiple delivery options. Click on the Add button to define a Delivery Method and a Deliver to Name and Email.
If Report Dashboard is selected then enter a valid name of one of your users. If you already select "Report Dashboard" under "Deliver Me a Copy Via" then you don't need to include yourself here.
Click the Save button again to save and schedule the report.
To view/modify previously saved reports. From the main toolbar of the report screen select "Show saved Reports" Which will display the following screen.
.png)
This will ONLY show the reports saved for this particular report. I.e if I went into the Shipment Log report then it will only show the Shipment Log reports saved.
To view other saved reports then go into that report screen.
Here you may Delete a previously saved report, or you may double click on the report shown and view the previously entered parameters, at which point you can change them and save them again.